Industry
Author
Want to share this article?
Common Key Performance Indicators in Oil and Gas
At a glance
- Key performance indicators—Definition, basic overview, and applications for any business
- Oil and gas industry—KPIs to lower costs, improve safety and productivity, and meet clean energy objectives
- Onshore—Asset utilization, workforce productivity, and customer satisfaction
- Offshore—Safety, production, cost, and environment
- Downstream—Yield, energy consumption, overall equipment effectiveness (OEE)
- Oil and gas KPI dashboard—Keeping a competitive edge
What is a key performance indicator?
Key performance indicators (also known as KPIs) measure value and indicate whether an organization’s business objectives are being met. KPIs track progress toward specific goals or targets and measure the performance of different aspects of a business.
KPIs often vary depending on the nature of the business and the goals each individual business wants to track. For example, KPIs for a sales team might include metrics like revenue growth, conversion rates, and average deal size. KPIs for a customer service team might include metrics such as customer satisfaction scores, response times, and first-call resolution rates.
No matter the industry, according to consultancy People.ai (Ref. 1), KPI development starts with determining key strategic objectives and selecting the right measure(s) for each objective before defining and documenting the selected measures for performance.
Yet, measuring aspects of business operations alone may not yield success. In many cases, the data related to KPIs guide strategic decision-making rather than benchmarking performance. For example, an oil and gas company may use the data to determine a timeline for future projects, required budgets, etc.
How to decide on the best key performance indicators for the oil and gas industry
Which key performance indicators provide the most insights for the oil and gas industry? Deloitte (Ref. 2) provides some illuminating information in this area, listing a range of financial and statistical performance benchmarks pertinent to modern energy sector success. Insights include revenue growth, operating margins, return on investment (ROI), asset turnover ratio, and total shareholder returns.
Some international oil companies like Shell (Ref. 3) and bp (Ref. 4) publish annual reports outlining their objectives and how closely their performance aligns with their goals. Both companies value lowering costs, improving safety and productivity, and advancing their energy transition objectives. A local pipeline engineering company, however, likely uses different KPIs compared to a global full-stream service provider. Ultimately, KPIs vary based upon the specific metrics each company feels effectively paves the way for growth.
Let’s explore relevant performance metrics for different sectors of the oil and gas industry, including onshore, offshore, and downstream operations.
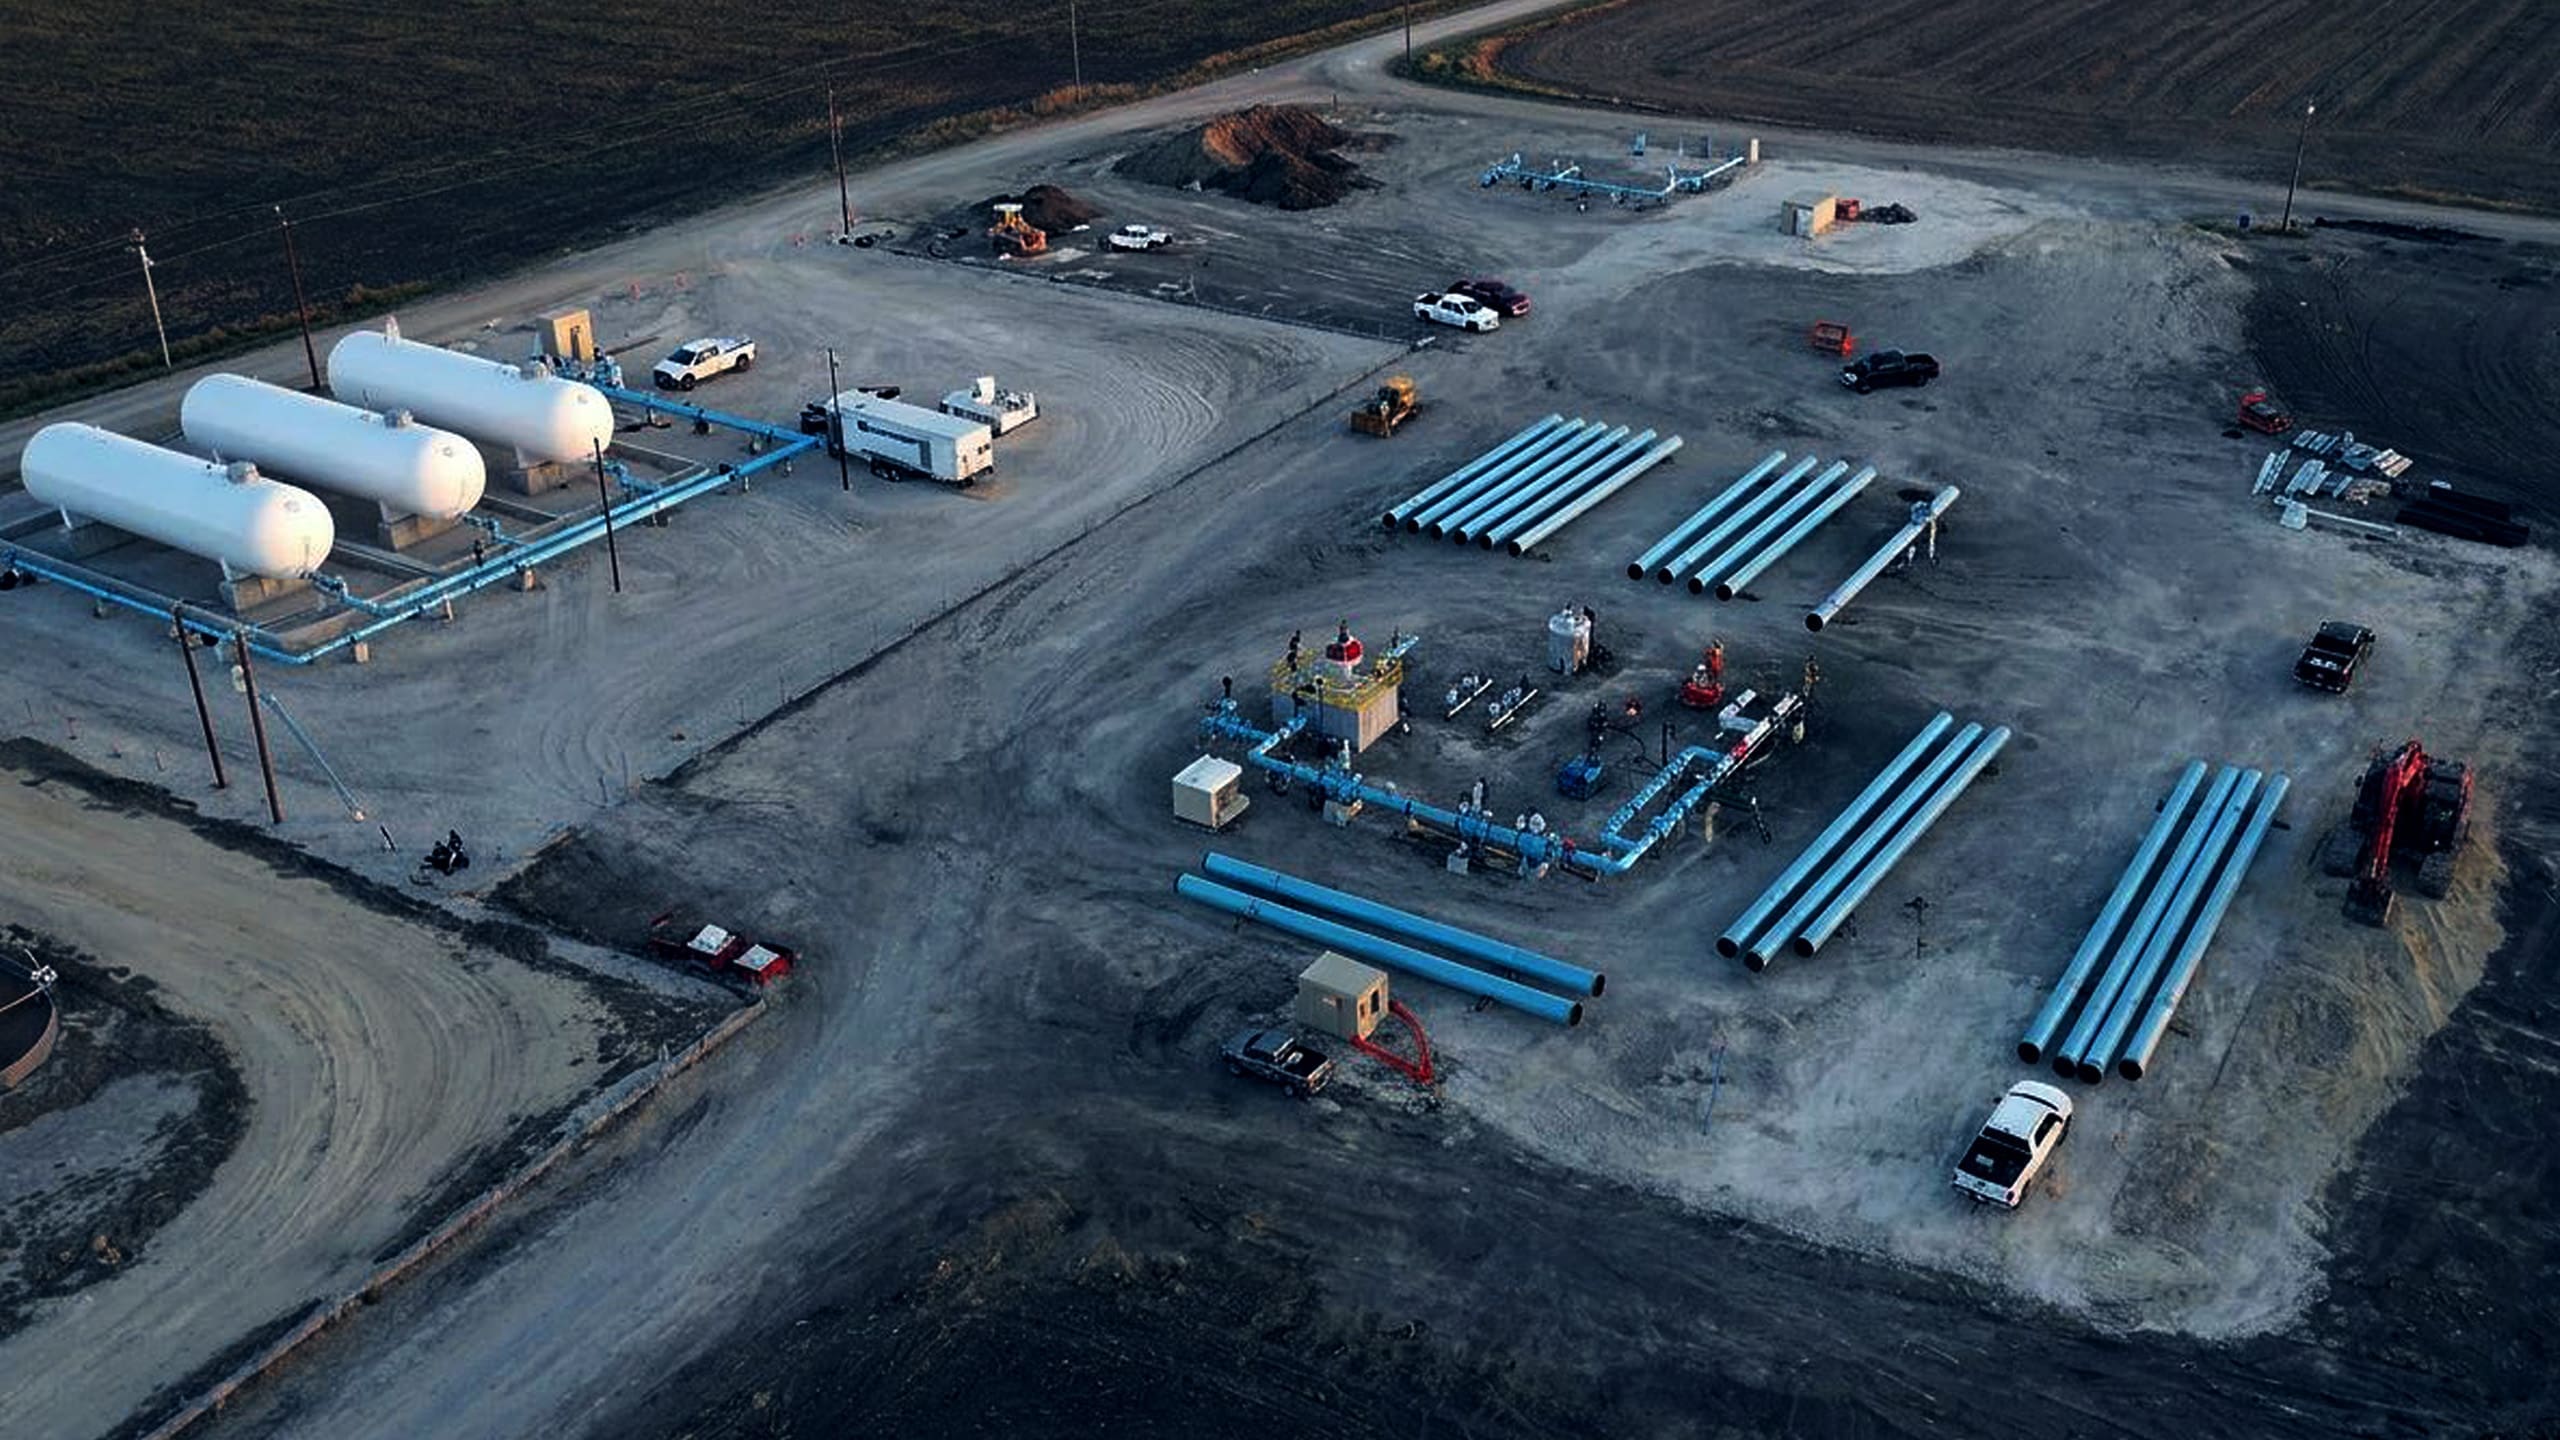
Onshore: Key performance indicators for the oil and gas industry
Safety, production, cost, and environmental metrics are also important for the onshore oil and gas industry. Additional KPIs for this sector can involve asset utilization, workforce productivity, and stakeholder satisfaction.
- Asset utilization: This KPI measures how effectively a company uses assets, such as drilling rigs, pipelines, and storage tanks. High asset utilization indicates that a company knows how to maximize existing infrastructure and resources. It’s just one avenue for reducing cost and increasing efficiency. To calculate asset utilization, divide the total hours or days your company uses an asset by its total available hours or days. Partnering with an engineering solutions company like Audubon can help optimize asset use to extend the productive life of existing infrastructure.
- Workforce productivity: This KPI measures the productivity of personnel, such as the number of barrels of oil produced per employee or the number of wells drilled per crew. High workforce productivity indicates that the company can achieve its production goals with fewer resources, which reduces cost and increases profitability. Workforce productivity is calculated by dividing the total output by the total number of employees or crews. According to the Federal Reserve Bank of New York,(Ref. 7) workers’ productivity caused a boom in oil and gas output in the years leading up to the COVID-19 pandemic after two decades of stagnation.
- Customer satisfaction: This KPI measures the satisfaction of customers such as oil and gas buyers and landowners. High customer satisfaction metrics indicate that a company understands how to successfully handle customer needs and expectations. Satisfied customers almost always improve the company’s reputation. As the digital world continues to expand, The Wall Street Journal(Ref. 8) suggests investing in technologies to improve stakeholder engagement. Artificial intelligence and machine learning, for example, can help predict behavior and identify value within customer segments.
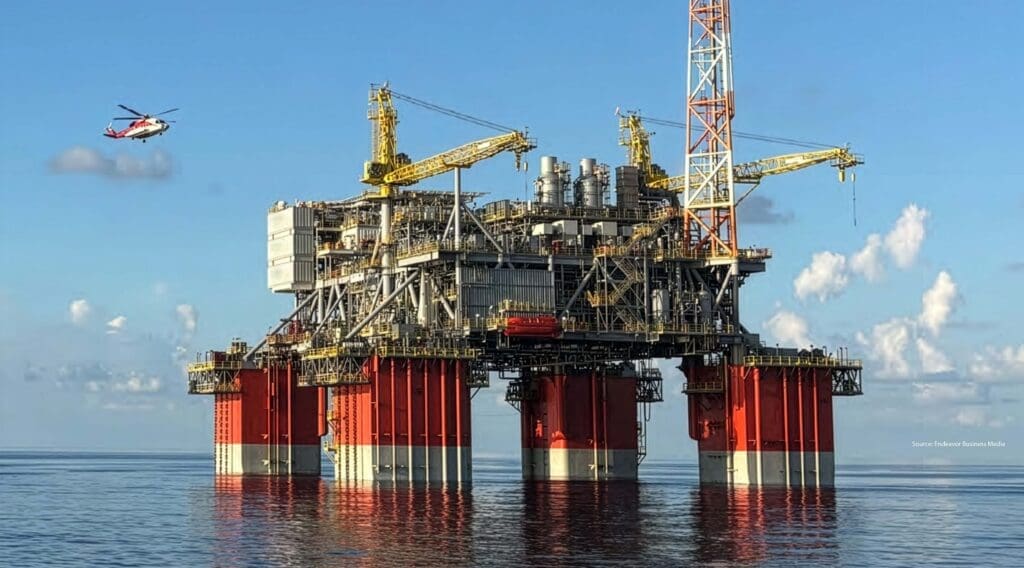
Offshore: Key performance indicators for the oil and gas industry
Offshore oil and gas companies use a wide range of KPIs to track progress and measure performance. Common key performance indicators across the oil and gas industry include safety, production, cost, and environmental metrics.
- Safety: The offshore oil and gas industry prioritizes safety. Therefore, the industry employs many strategies to measure safety performance. The International Association of Oil and Gas Producers (IOGP) published a report(Ref. 5) focusing on process-related safety KPIs. Some of the KPIs listed include lost-time injury frequency rate (LTIFR), total recordable injury frequency rate (TRIFR), and safety observation programs.
- Production: Coming in a close second as a priority for the offshore oil and gas industry is production. Metrics to track production might include total production volume, production efficiency, and uptime. These KPIs show up in company annual reports, investor presentations, and industry reports. We recommend referencing Solomon’s worldwide offshore production operations performance analysis.
- Cost: Cost control is critical, and there are many key performance indicators that can be used for the offshore oil and gas industry to measure cost performance—to name a few, capital expenditure (CAPEX), operating expenditure (OPEX), and unit production cost. These KPIs can be found in company financial statements, investor presentations, and industry reports, such as those published by Wood Mackenzie.
- Environment: In today’s era of clean energy transformation, offshore operators increasingly rely on environmental performance markers. These KPIs measure environmental impact, such as greenhouse gas emissions, energy intensity, and water usage. Dow Jones Sustainability Indices,(Ref. 6) launched in 1999, reveal how long-standing, global, sustainability benchmarks help companies succeed.
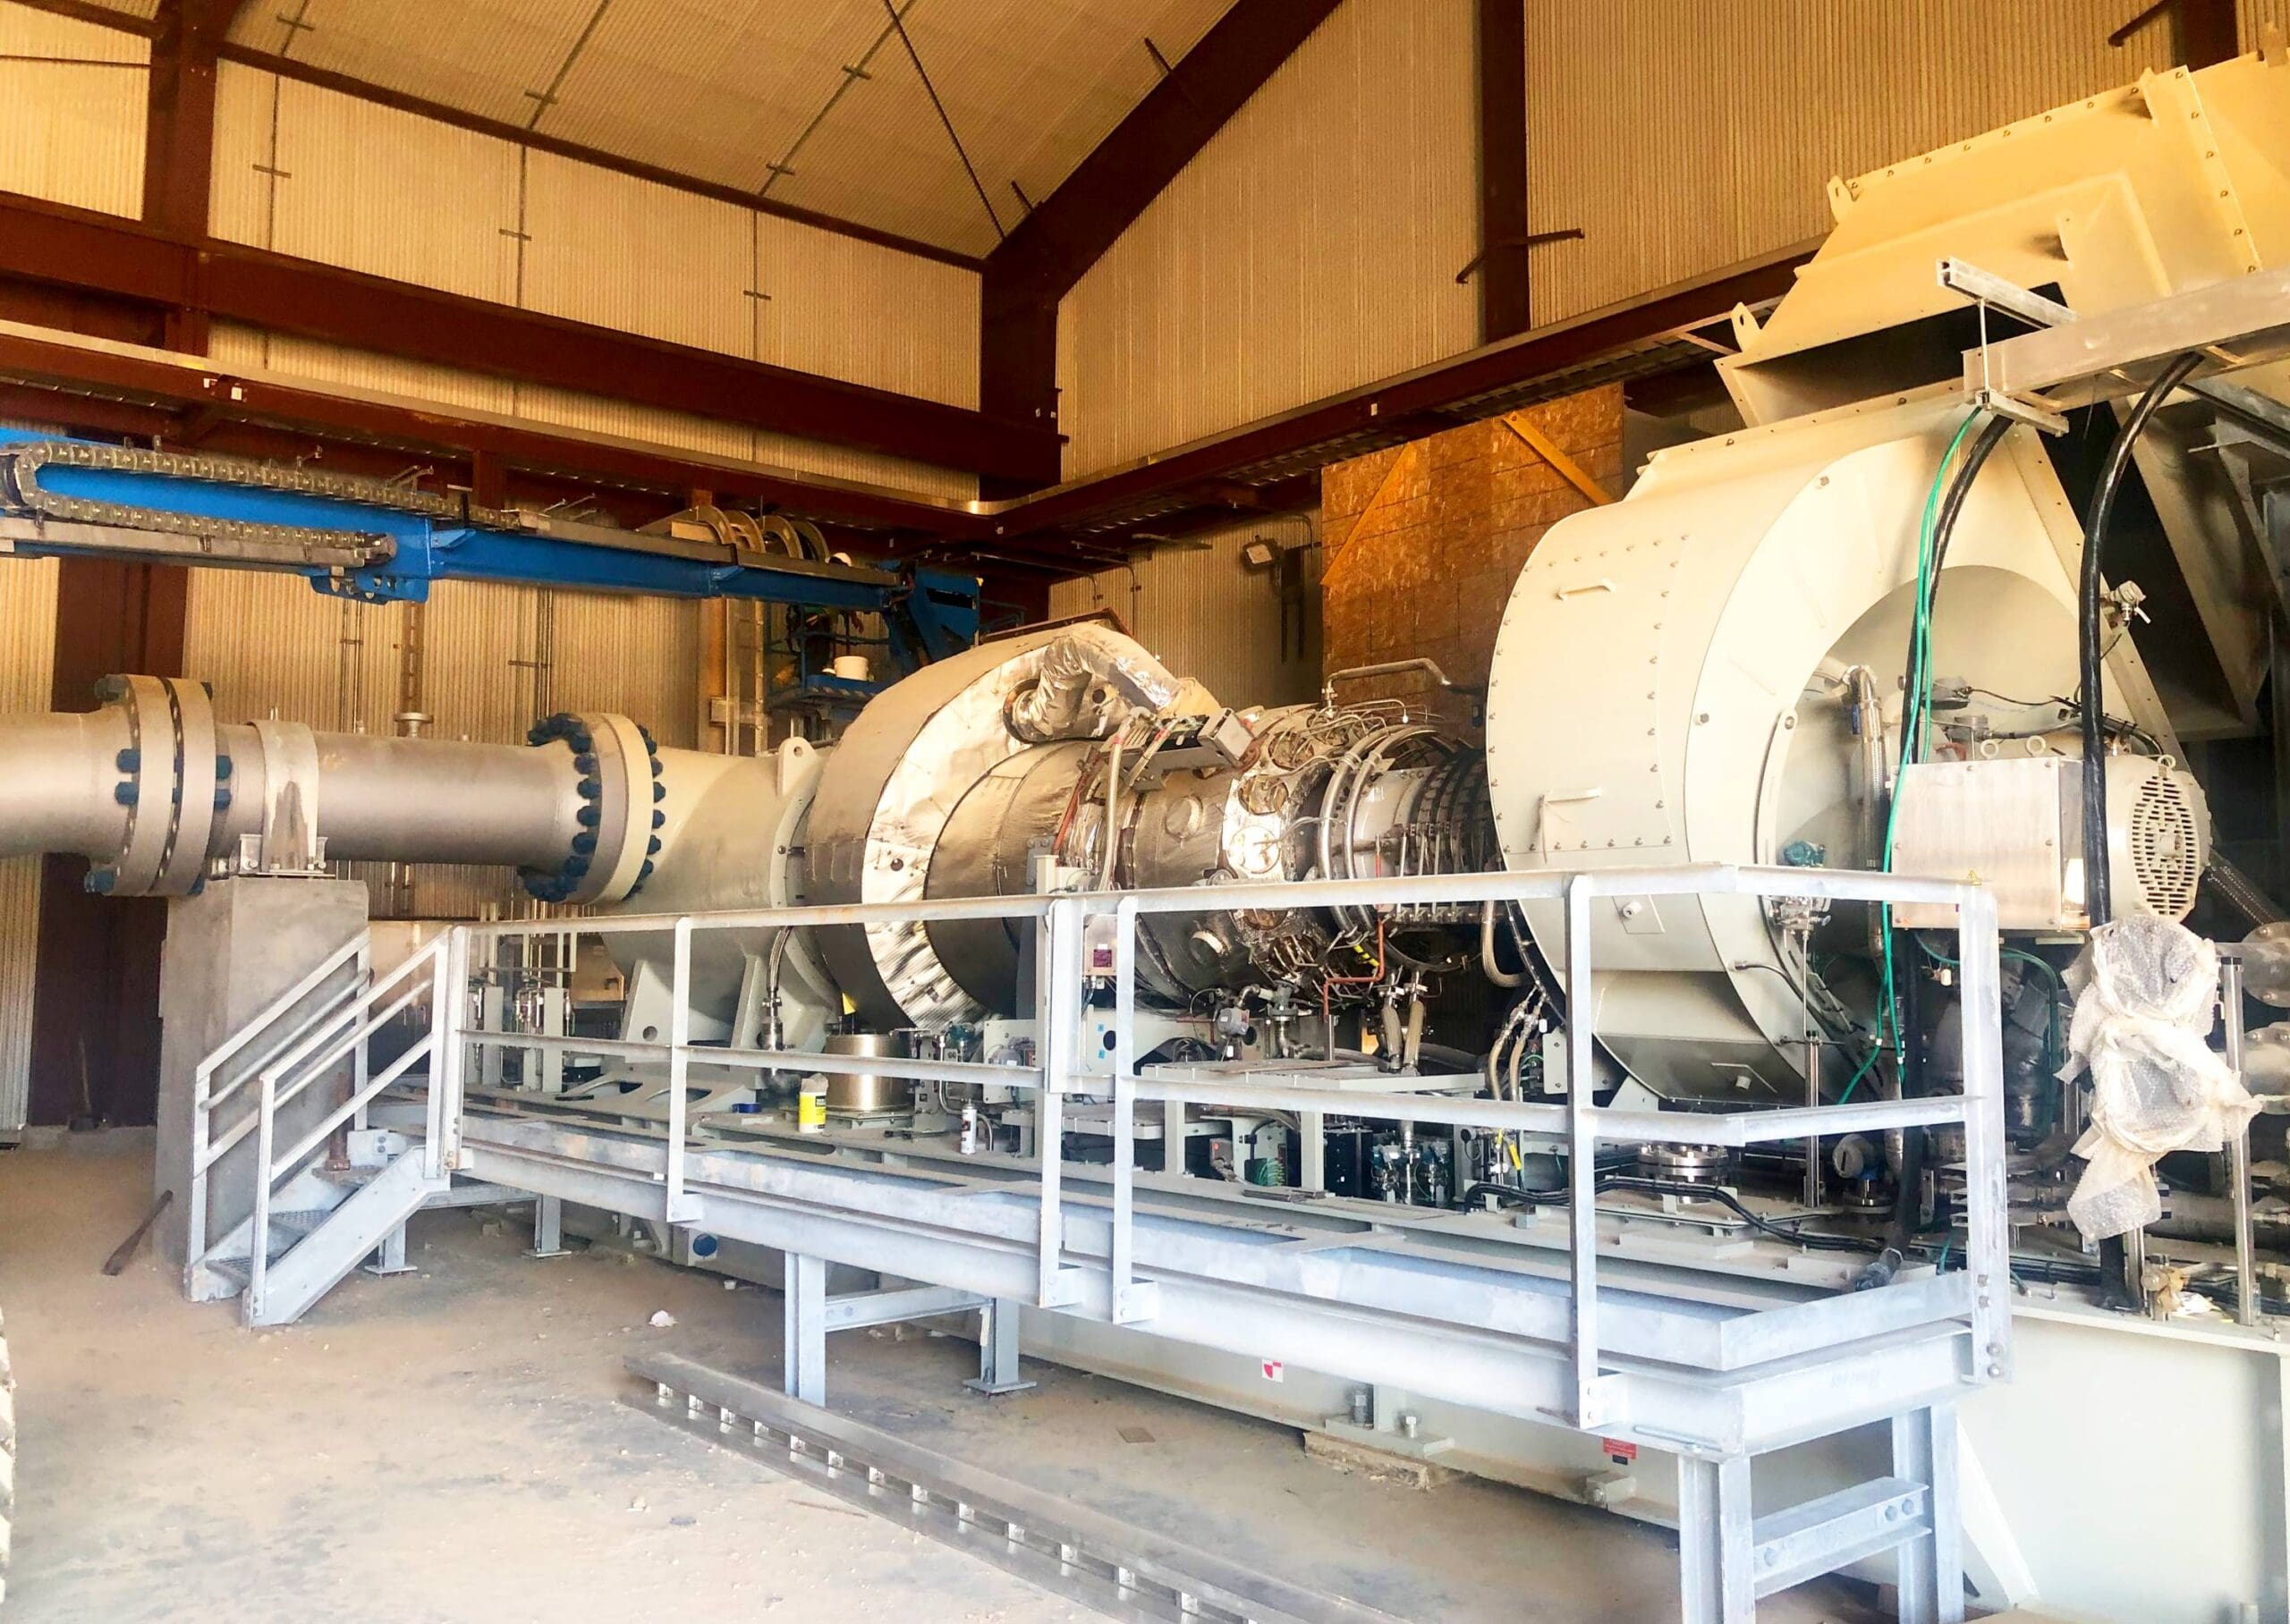
Downstream: Key performance indicators for the oil and gas industry
Moving downstream to refinery operations introduces other performance nuances.
- Yield: Yield measures the amount of finished product from a given amount of raw material. As one of the most critical KPIs for refining operators, it directly impacts profitability. Higher yield means more product can be made from the same amount of feedstock. This KPI reduces production cost and increases revenue. Conversely, lower yield results in higher cost and lower margin. According to Visible Alpha,(Ref. 9) refiners can adjust product yields in evolving market conditions by varying the number of refinery processing units as well as the type of crude oil used.
- Energy consumption: The refining industry places a heavy emphasis on energy consumption. Given the energy-intensive nature of the operations, measuring the amount of energy required to produce a unit of product serves as a valuable KPI. Reducing energy consumption improves the bottom line by reducing cost while simultaneously enhancing environmental sustainability. A recent IPTC paper(Ref. 10) gives a detailed description of how companies can use past performance, industry surveys and benchmarks, and known energy improvement potential for establishing a better KPI dashboard for energy consumption.
- Overall equipment effectiveness: OEE, a commonly used KPI, measures the performance of equipment to identify opportunities for improvement. This metric is calculated as a factor of availability, performance, and quality. OEE data help upstream operators improve transparency, simplify production facility control, enhance reliability, and decrease downtime.(Ref. 11)
Staying competitive with the right oil and gas KPI dashboard
Metrics help companies maintain profitability, respond to changing market conditions, and drive sustainability in the oil and gas sector. Companies focused on competitive pricing, quality, service, innovation, efficiency, flexibility, resilience, agility, and sustainability succeed in a rapidly changing market. A well-honed oil and gas KPI dashboard will keep your company abreast of changes in the industry.
The first step to achieving a competitive edge lies in setting quantitative benchmarks from which to measure performance. Setting and tracking KPIs empower companies to identify strengths and weaknesses. Taking proactive measures to improve your company’s performance in weak areas often produces positive results. You will improve profitability and stay ahead of your competition.
Understanding your KPIs is critical for enhancing operations and maximizing asset utilization. Working closely with a services provider, like Audubon, who offers comprehensive engineering, procurement, construction (EPC), project management, and fabrication solutions, will help you get your oil and gas KPI dashboard on track. If you’re ready to transform your operations with improvements in efficiency and production, contact us to get started.
References:
1) People.ai
2) Deloitte
3) Shell
4) bp
5) IOGP report
6) Dow Jones Sustainability Indices
7) Federal Reserve Bank of New York
8) The Wall Street Journal
9) Visible Alpha
10) IPTC paper
11) Germanedge

Related services we offer
Maximize project value with leading technologies and an agile, dedicated team.
Improve productivity and efficiency while reducing downtime and costs.
Safely and reliably extend productive life with customized solutions that detect damage and combat corrosion.
Related news + insights
Pipelines + Terminals